
This guide will show you how to use simple Microsoft tools to create reports in Dynamics.
You’ll find that you can produce detailed reports with these simple tools. However if you’re looking for more sophisticated visualisations, Power BI is better suited for this.
You can report on any data which is stored in the Dataverse, Microsoft’s common data store for Dynamics 365 and other Power Apps.
Examples of easy to make Dynamics reports include
We’re covering these ways of producing reports in Dyanmics
Most business users are familiar with Excel and it’s a great starting point for getting familiar with reporting in Dynamics 365. It’s easy to export Dynamics data to Excel
Say, for example, you want to run a simple report on new leads.
In Dynamics, click on leads
From the view selector, choose a view which shows the data you want to report on. If you can’t see a view that shows exactly what you need, use this guide to help create a new one

You can adjust the search criteria and change which columns are displayed if you like, using these buttons

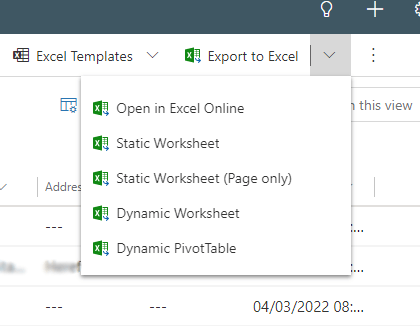
Then click the dropdown alongside Export to Excel and choose Static Worksheet
Your Excel spreadsheet will now download. You can now report on the data in Excel as you usually would, using elements like
You’ll find this way of reporting particularly useful if you want to send the reports offsite or to users who don’t have access to Dynamics.
For regular, repeated reporting, you might find Excel a little slow and inflexible. Dynamics’ built in tools can help create reports which are updated in real time and you can view them within the system
Say, for example, you want to report regularly on where your leads are coming from. You have a lead source field with 10 options. You’d like to be able to see what the popular lead sources are each month.
The starting point with nearly all Dynamics reporting is to create a view.
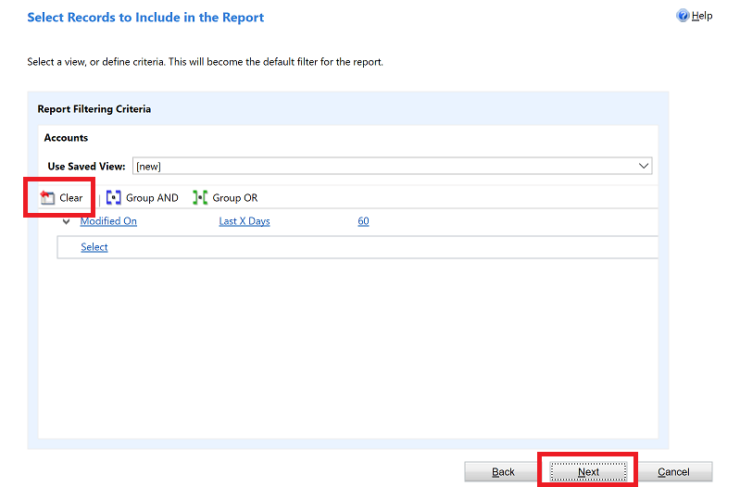
We’ll cover using Modern Advanced Find. If you want to use Advanced Find, look here for details


You’ll now see a simple chart displaying your popular lead sources
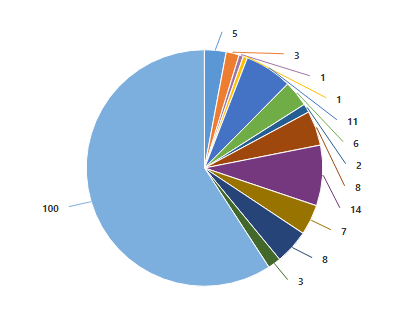
Click on any of the segments to show the leads only from that source.
If the chart you are looking for doesn’t appear in the list, you can use the chart editor

Your simple bar chart is ready to use
To view your charts all together in one ‘report’, you can make a dashboard to display charts and data lists
Starting with a new dashboard
Add the charts you need, and press Save
You’ll now be able to view the dashboard in the dashboard chooser, under My Dashboards
When you’re confident creating view and charts to add to dashboards, the next step is to use interactive dashboards. These are often used as an at-a-glance way to mange your work. You can see records, data, charts all in one place. The items are all interactive, meaning you can drill down each element to move deeper into the data or view associated records.


For more detail on using report wizard, see Microsoft’s documentation
That covers the main ways of reporting in Dynamics 365. However there is another more powerful way – Microsoft PowerBI, which is covered here
Synchronise your WooCommerce orders with Dynamics 365